|
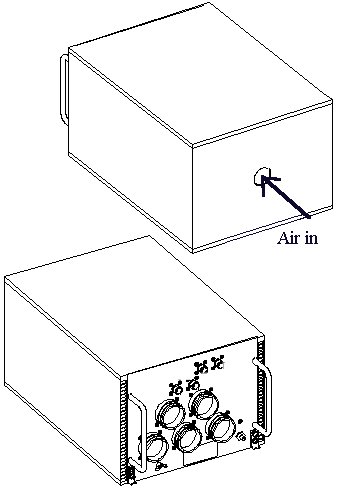
CAS Ltd. was to design a cooling system for a 250 Watt
computer built for major aircraft manufacturer. The computer,
shown in Figure 1, was housed in an aluminum chassis measuring
265 mm wide x 200 mm high x 365 mm deep. The chassis exterior
was cooled by natural convection and radiation. The chassis
interior held 12 cards that were fastened to a heat exchanger
by Calmark wedge-locks. The plate-fin heat exchanger consisted
of 31 horizontal fins mounted on each side of the chassis. The
heat exchanger was cooled by forced airflow from the fan, as
shown in Figure 1.
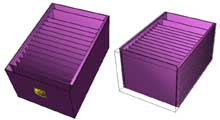
Before building a prototype, the system was designed using
Coolit. The Coolit model of the computer is shown in Figure 2.
Parts of the system in the figure are hidden to show the
interior detail such as the cards and the heat exchanger fins.
To meet the manufacturer's requirements, four analyses were
performed using different mass flow rates corresponding to
different flight conditions. The pressure drop across the heat
exchanger predicted by Coolit was recorded as a function of
the mass flow rate through the system.
Pressure Predictions
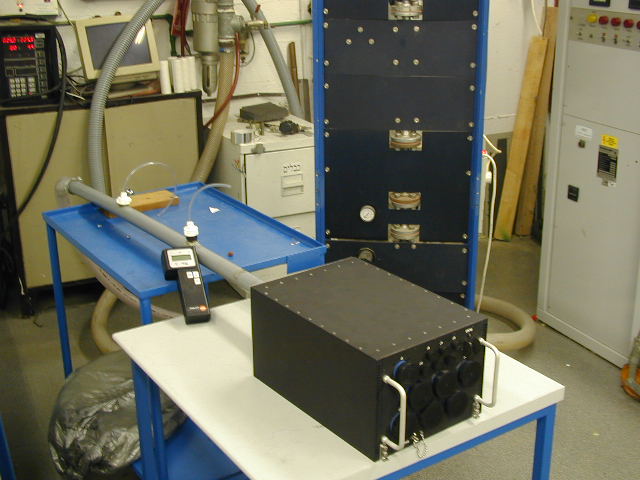
Once the system prototype was designed and built, an
experiment was conducted to determine the pressure drop across
the chassis prototype, D
P34 = P4 - P3. The pressure
measurement points are shown in the schematic of the
experiment in Figure 3. Figure 4 shows a photograph of the set
up. Eleven experiments were run with different mass airflow
rates as shown in Figure 5 (black dots). The corresponding
pressure readings were recorded on a manometer. The test data
were fit with the best fit curve (red solid line in Figure 5)
and the results were compared with the Coolit predictions
(magenta line in Figure 5). Excellent agreement was observed
throughout the entire pressure-flow range.
Temperature Predictions
To verify the temperature predictions, a test was performed at
one of the designed mass flow rates. The temperature distribution
across the "cold plate" was recorded at steady state. The "cold plate"
temperature should not exceed 78 degrees C.
The "cold plate" temperature measurement locations are shown in Figure 6.
The ambient conditions were measured at the heater are shown in Table 1.
Table 1
| Location |
Test (deg. C) |
Prediction (deg.C) |
| Inlet |
24.4 |
24.5 |
| Slot 1 |
59.1 |
57.7 |
| Slot 2 |
62 |
60 |
| Slot 3 |
64.2 |
63.1 |
| Slot 4 |
66.9 |
64.4 |
| Slot 5 |
68.8 |
65.3 |
| Slot 6 |
70.2 |
67.3 |
| Slot 7 |
72.1 |
68.8 |
| Slot 8 |
72.4 |
70.3 |
| Slot 9 |
73.6 |
71.4 |
| Slot 10 |
74 |
72.9 |
| Slot 11 |
75.2 |
73.2 |
| Slot 12 |
76.8 |
77.3 |
| Outlet |
67.5 |
67 |
Table 2 and the accompanying graph, Figure 7, compare the predicted and
actual temperatures for the different locations based on the above
boundary conditions. When the test data were compared against the
Coolit predictions, the results were within 5%.
Table 2
| Air Temperature |
71 deg.C |
| Atmospheric Pressure |
1008 mbar |
| Inlet temperature |
24.5 deg.C |
| Inlet air mass flow |
0.86 PPM |
|