|
Developer/manufacturer Miteq Corp had been using a healthy
safety factor when calculating thermal loads in its satellite
communications subsystems. But this approach was adding unnecessary
cost and weight to the equipment, so the company enlisted Coolit
to optimize its designs.
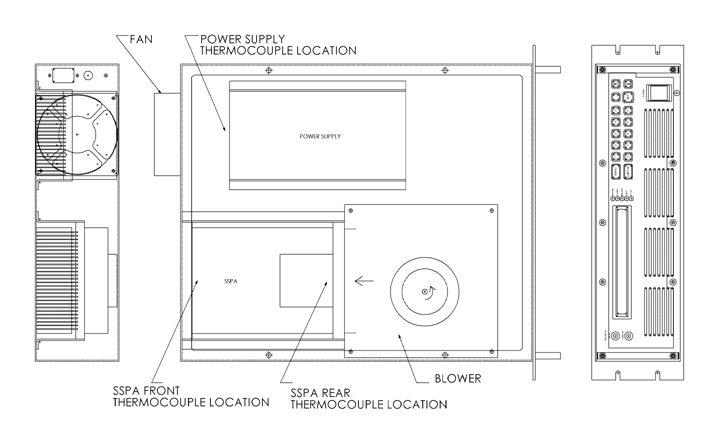
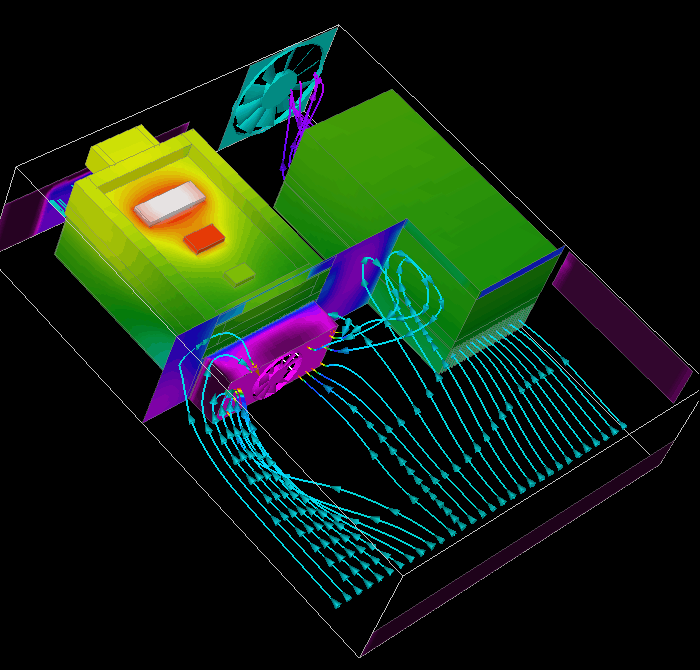
To assess the accuracy of the Coolit predictions, Miteq benchmarked
a 3 RU rack-mounted SSPA (Solid State Power Amplifier) whose main
components are a 3-stage power amplifier and power supply. A
bonded-fin heatsink is mounted beneath each main component, and
the assembly is cooled by a side-by-side blower
and axial fan arrangement that pulls cooling air into the enclosure
and forces it through the SSPA and power supply
heat sink fins before exhausting it out the rear vents.
Since the subsystem was still in the design stage, a mockup was
required. An aluminum housing was machined to match the 'form
factor' and thermal mass of the final SSPA housing, and the
actual 100 Watt power supply was mounted inside the 3RU enclosure.
To simulate the FET amplifiers, engineering used resistors,
bolted inside the machined housing and driven by the power supply,
that delivered equivalent power dissipation (200 Watts).
Thermocouples were mounted in 3 locations: at the lowest
powered FET amplifier (SSPA rear), at the highest powered FET
(SSPA front), and in the exhaust air stream exiting the power supply heat sink.
After power-up, the subsystem reached steady-state temperature in
30 minutes. Temperature measurements were taken once every 60 seconds
for 4 hours. The results are shown in the table below; the Coolit predictions matched test
temperatures within 3%.
|
|
SSPA
Rear
|
SSPA
Front
|
Power
Supply
|
|
Coolit prediction (deg. C)
|
38.5
|
49.4
|
26.9
|
|
Actual (deg. C)
|
37.9
|
48.8
|
26.3
|
With access to highly accurate
predictions, Miteq expects to eliminate a minimum of three design/test
iterations per subsystem design and reap significant savings in development
time and expense.
|